
If your learning tech stack has grown over a few years, it probably feels a little like a the wide west.
Someone launched an LMS. Then a microlearning tool showed up for frontline teams. Someone else bought a video platform. A business unit stood up a community space. A dashboard popped up to report on it all. Each decision made sense at the time, but now learners are asking a simple question you cannot answer in one sentence: Where do I go?
That is exactly why Learning Ecosystem Mapping works so well. It gives you a fast, practical way to see what you really have, how it overlaps, where it is missing key capabilities, and what to fix first.
What is Learning Ecosystem Mapping?
Learning Ecosystem Mapping is a structured audit. You inventory the platforms that support learning and performance, then place them into functional categories based on what they actually do.
This matters because most organizations get stuck in acronym conversations. LMS vs LXP vs LRS. Those labels describe software categories, but they don’t necessarily describe the how, when, and why your learners engage with them.
Mapping by function keeps the conversation grounded in outcomes and user needs.
The quadrant model for Learning Ecosystem Mapping
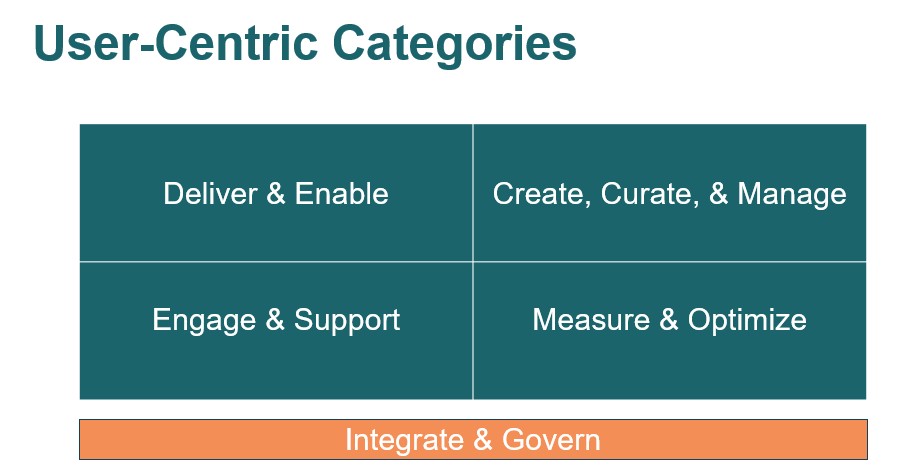
Here is the simple model we use. Four functional quadrants, plus a layer that holds everything together.
Quadrant 1: Deliver and Enable
Tools that make learning accessible, engaging, and timely for learners.
Examples: LMS, LXP, mobile learning, microlearning, video delivery platforms.
Quadrant 2: Create, Curate, and Manage
Tools that help teams build, update, and govern content at scale.
Examples: authoring tools, LCMS, content libraries, asset repositories.
Quadrant 3: Engage and Support
Tools that strengthen coaching, peer learning, and in the moment support.
Examples: mentoring platforms, coaching tools, communities of practice, collaboration tools, AI support.
Quadrant 4: Measure and Optimize
Tools that capture activity and performance signals, then turn them into insights.
Examples: learning record stores, analytics dashboards, reporting layers, survey tools.
The layer that makes it work: Integrate and Govern
Integration is your data flow, authentication, and system connections. Governance is how decisions get made, who owns what, and how you prevent sprawl.
Most ecosystem problems are not caused by a single platform. They are caused by weak integration, unclear governance, or both.
Step by step: How to do Learning Ecosystem Mapping
You can run a useful Learning Ecosystem Mapping session in a few hours if you prep the inventory first. Here is the process.
Step 1: Inventory every learning and performance tool
Start by listing every platform that touches learning, enablement, or performance support. Include tools owned outside L&D. Learners do not care who pays for it. They experience it as one ecosystem.
For each tool, capture:
- Tool name and owner
- Primary audience (learners, managers, admins, leaders, designers)
- Primary purpose in plain language
- Key workflows it supports
- Current integrations (SSO, HRIS, APIs, exports)
- Adoption signals (active users, frequency, completion volume, support tickets)
- Contract renewal date and cost
If you are unsure whether a tool belongs, include it. It is easier to remove later than to rediscover mid process.
Step 2: Place each tool into the quadrant it best fits
Now do the actual Learning Ecosystem Mapping. Put each tool into the quadrant that reflects its main value.
Some tools will touch multiple quadrants. That is normal. Choose the primary quadrant, then note secondary functions as comments.
Step 3: Spot overlaps and redundancies
Once everything is placed, overlaps become obvious. This is where the map starts earning its keep.
Common redundancy patterns:
- Two microlearning platforms used by different regions
- Multiple content libraries with similar catalogs
- Several collaboration tools hosting “communities” that do not connect
- Multiple reporting solutions with inconsistent definitions
When you see overlap, ask:
- Are these tools solving the same problem or different problems?
- Is one tool legacy, underused, or duplicated because people did not know a capability existed?
- Is the overlap caused by a real capability gap in the primary system, or by inconsistent adoption?
Redundancy is not always wrong. Unmanaged redundancy is what causes confusion, fragmented data, duplicated effort, and wasted spend.
Step 4: Find gaps that create friction
Gaps are not just empty quadrants. Gaps show up as workarounds.
Typical gaps:
- Learners cannot easily find the right resource at the right time
- Content governance is weak, so outdated assets live forever
- Managers are not supported, so learning does not transfer into performance
- Measurement stops at completions, so impact is hard to defend
- Systems do not connect, so the experience feels fragmented
A gap is a broken capability. Sometimes you fix it with a new tool. Often you fix it by improving workflows, tightening governance, or integrating what you already own.
Step 5: Assess integration and governance
In many organizations, the biggest opportunities from Learning Ecosystem Mapping come from the glue layer.
Ask:
- Can learners move across tools without multiple logins?
- Does HR data flow into learning systems reliably?
- Can you track learning beyond completions, including coaching, practice, and performance support usage?
- Who approves new learning tools, and what criteria do they use?
- Who owns content standards, accessibility, branding, and retirement?
- What happens when two teams want to buy the same type of platform?
If these answers are unclear, that is a signal. You likely need governance before you need another tool.
What to look for after you map everything
After Learning Ecosystem Mapping, a few patterns typically stand out. Here are the big ones and what they usually mean.
Pattern 1: Too many front doors
Learners get sent to multiple places depending on the program. That is when adoption drops, even if the content is great.
Possible solutions:
- Create a single entry point experience, even if it starts as a curated landing page
- Enable single sign on where possible
- Standardize naming, navigation labels, and pathways across systems
Pattern 2: Content is constantly being rebuilt
This shows up when multiple teams create similar courses, store assets in different places, and maintain parallel versions of the same content.
Possible solutions:
- Build a shared content inventory and a retirement process
- Create templates and standards for design, voice, and branding
- Clarify where reusable content should live and who owns it
Pattern 3: Managers are missing from the ecosystem
Many ecosystems support learners and administrators, but forget the manager experience. That is where performance reinforcement should live.
Possible solutions:
- Add manager prompts and coaching guides tied to key programs
- Provide exception alerts, like learners who fail an assessment or fall behind
- Create short manager enablement resources that match real work rhythms
Pattern 4: Measurement exists, but it does not connect
You might have dashboards, but leaders still ask, “So what changed?” That usually means measurement is not aligned to outcomes, or data is fragmented across platforms.
Possible solutions:
- Define a small set of outcome aligned measures for priority programs
- Standardize identifiers and definitions across systems
- Build one leadership view that answers the questions leaders actually ask
How to prioritize improvements after Learning Ecosystem Mapping
A map is only useful if it turns into decisions. Here is a simple way to prioritize without overcomplicating it.
Use an impact and effort lens
For each opportunity, score:
- Impact on learner experience and business outcomes
- Effort required, including people, process, and technical lift
Then bucket the work.
Bucket 1: Quick wins
High impact, low effort. Changes you can deliver in weeks.
Examples: SSO enablement, navigation cleanup, simplified entry point, reducing duplicate pathways.
Bucket 2: Strategic builds
High impact, higher effort. These are the moves that reshape the ecosystem.
Examples: governance council creation, integration work, platform consolidation, unified analytics approach.
Bucket 3: Retire or defer
Lower impact or unclear value. Often legacy tools, pilots that never scaled, or duplicate platforms with low adoption.
Retiring tools is not just cost savings. It reduces noise in the ecosystem.
Use a strategic filter before buying anything new
Before adding another platform, ask:
- Does this solve a real performance problem?
- Can we measure its impact on business outcomes?
- Does it fit how people actually work?
If the answer is fuzzy, pause. You probably have a strategy or governance gap first.
A quick example
Imagine a retail organization trying to reduce new hire ramp up time and improve sales confidence.
They have:
- An LMS for onboarding and compliance
- A microlearning tool used by stores
- A video platform used by corporate training
- A collaboration space where top store managers share tips
After Learning Ecosystem Mapping, they discover:
- Learners have three different places to go, and none share progress data
- Content is duplicated between systems
- Managers want visibility into who is struggling, but only receive completion reports
- There is no consistent governance process, so new tools keep appearing
Their first wins are not a full platform replacement. They are:
- Turning on SSO and creating a single front door
- Clarifying where core onboarding content lives and retiring duplicates
- Adding manager exception alerts tied to weekly learning check ins
- Establishing governance to prevent redundant purchases
That is the power of Learning Ecosystem Mapping. It converts complexity into a plan.
Key takeaways
- Learning Ecosystem Mapping helps you see what you actually have, not what you assume you have.
- Mapping by function reveals overlaps and gaps faster than acronym based debates.
- Many of the best improvements come from integration and governance, not new tool purchases.
- Prioritization turns your map into momentum, starting with quick wins.
Ready to map your ecosystem?
If your learning stack feels bloated, confusing, or hard to measure, Learning Ecosystem Mapping is the fastest way to regain clarity.
If you want help facilitating a mapping session, identifying quick wins, or turning the results into a roadmap, Tang Technology can help. Reach out on the contact form to get the conversation started.